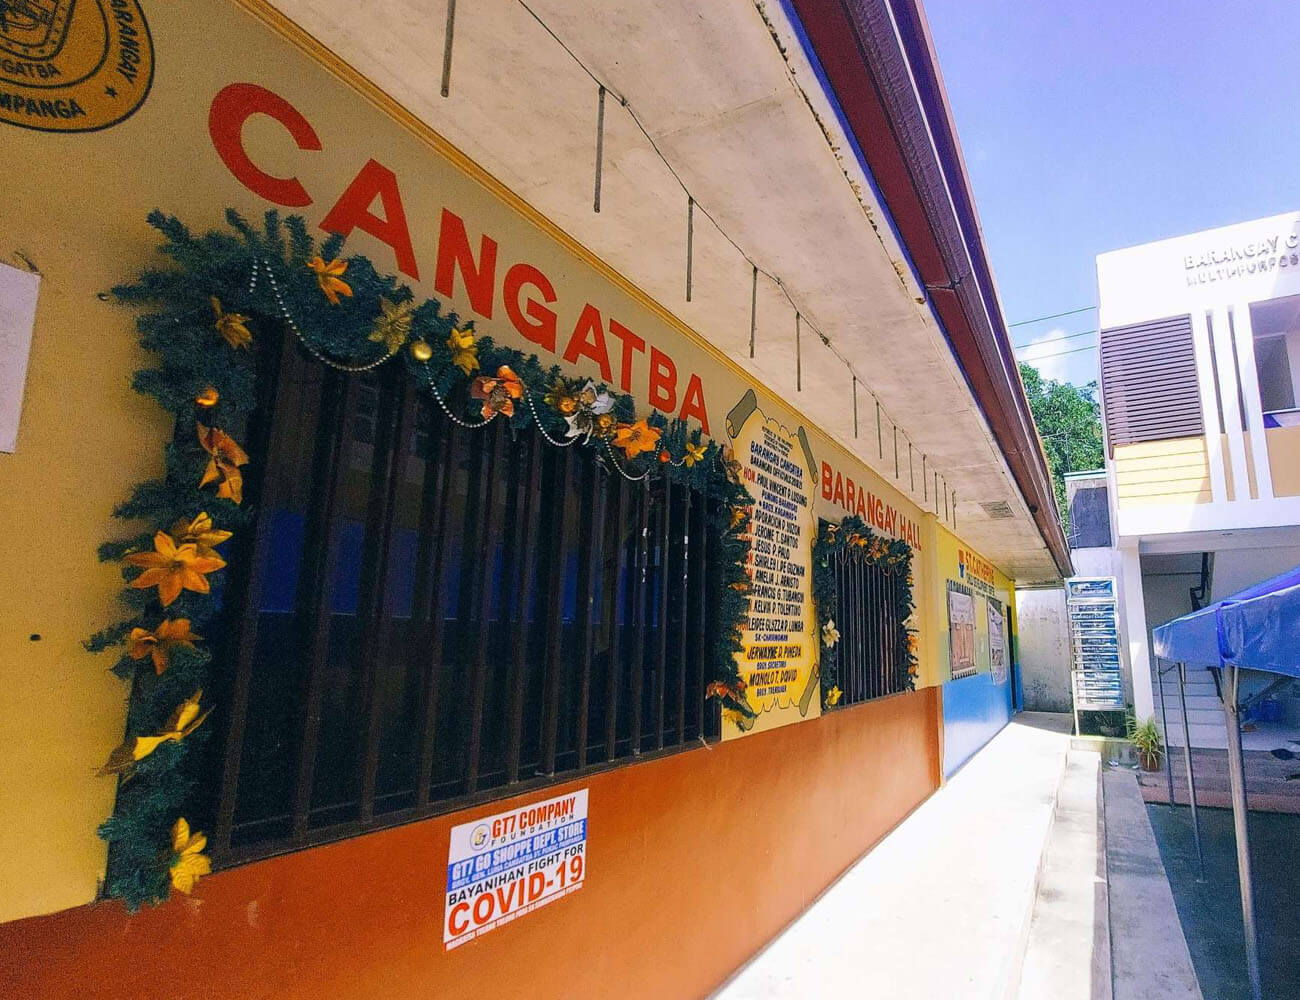


Cangatba is a barangay in the municipality of Porac, in the province of Pampanga. It’s population as determined by the 2020 Census was 2,937. This represented 2.09% of the total population of Porac.
Demographics
Households
The house population of Cangatba in the 2015 Census was 2,891 broken down into 703 households or an average of 4.11 members per household.
Census date | Household population | Number of households | Average household size |
|---|---|---|---|
1990 May 1 | 3,022 | 485 | 6.23 |
1995 Sep 1 | 1,460 | 262 | 5.57 |
2000 May 1 | 1,854 | 375 | 4.94 |
2007 Aug 1 | 2,393 | 495 | 4.83 |
2010 May 1 | 2,472 | 529 | 4.67 |
2015 Aug 1 | 2,891 | 703 | 4.11 |
Population by age group
According to the 2015 Census, the age group with the highest population in Cangatba is 15 to 19, with 326 individuals. Conversely, the age group with the lowest population is 75 to 79,with 27 individuals.
Details
Combining age groups together, those aged 14 and below, consisting of the young dependent population which include infants/babies, children and young adolescents/teenagers, make up an aggregate of 26.15% (756). Those aged 15 up to 64, roughly, the economically active population and actual or potential members of the work force, constitute a total of 67.62% (1,955). Finally, old dependent population consisting of the senior citizens, those aged 65 and over, total 6.23% (180) in all.
The computed Age Dependency Ratios mean that among the population of Cangatba, there are 39 youth dependents to every 100 of the working age population; there are 9 aged/senior citizens to every 100 of the working population; and overall, there are 48 dependents (young and old-age) to every 100 of the working population.
The median age of 27 indicates that half of the entire population of Cangatba are aged less than 27 and the other half are over the age of 27.
Age group | Population (2015) | Age group percentage |
|---|---|---|
80 and over | 36 | 1.25% |
75 to 79 | 27 | 0.93% |
70 to 74 | 38 | 1.31% |
65 to 69 | 79 | 2.73% |
60 to 64 | 94 | 3.25% |
55 to 59 | 123 | 4.25% |
50 to 54 | 124 | 4.29% |
45 to 49 | 164 | 5.67% |
40 to 44 | 192 | 6.64% |
35 to 39 | 210 | 7.26% |
30 to 34 | 214 | 7.40% |
25 to 29 | 238 | 8.23% |
20 to 24 | 270 | 9.34% |
15 to 19 | 326 | 11.28% |
10 to 14 | 265 | 9.17% |
5 to 9 | 251 | 8.68% |
1 to 4 | 202 | 6.99% |
Under 1 | 38 | 1.31% |
Historical population
The population of Cangatba fell from 3,022 in 1990 to 2,937 in 2020, a decrease of 85 people over the course of 30 years. The latest census figures in 2020 denote a positive growth rate of 0.33%, or an increase of 46 people, from the previous population of 2,891 in 2015.
Census Date | Population | Growth rate |
|---|---|---|
1990 May 1 | 3,022 | – |
1995 Sep 1 | 1,460 | -12.74% |
2000 May 1 | 1,854 | 5.26% |
2007 Aug 1 | 2,393 | 3.58% |
2010 May 1 | 2,472 | 1.19% |
2015 Aug 1 | 2,891 | 3.03% |
2020 May 1 | 2,937 | 0.33% |
This Cangatba, Porac, Pampanga Profile – PhilAtlas appeared first on https://philatlas.com/